))
))
))
))
))
))
))
))
| Daily Statistics | |||||
| Day [+] | Tmin °C | Tmax °C | Mean °C | σ | n |
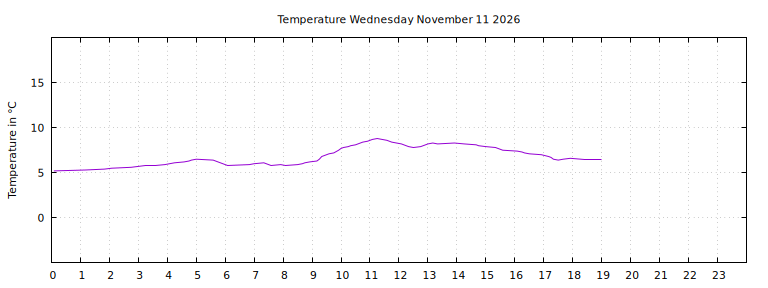
| Wednesday November 11th | 5.2 | 8.8 | 7.0 | 102% | 90 |
| Tuesday November 10th | 2.6 | 5.1 | 4.0 | 81% | 57 |
| Monday November 9th | 2.1 | 6.1 | 4.4 | 116% | 80 |
| Sunday November 8th | -0.5 | 4.9 | 2.8 | 164% | 74 |
| Saturday November 7th | -2.5 | 7.9 | 3.0 | 310% | 167 |
| Weekly Statistics | |||||
| Week [+] | Tmin °C | Tmax °C | Mean °C | σ | n |
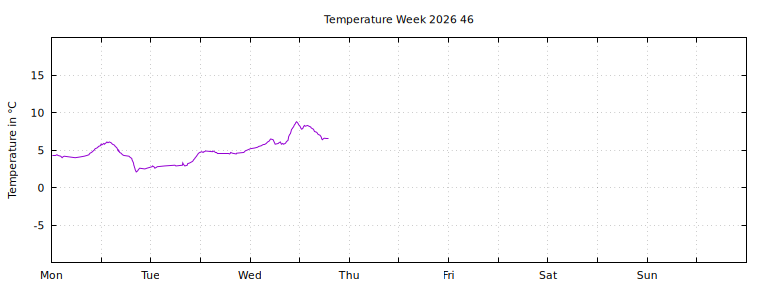
| Week 46 (November 9th) | 2.1 | 8.8 | 5.3 | 171% | 227 |
| Week 45 (November 2nd) | -2.5 | 11.2 | 3.9 | 310% | 970 |
| Week 44 (October 27th) | 1.9 | 14.2 | 9.0 | 283% | 701 |
| Updated every 5:th minute. |
|
|
| Monthly Statistics | |||||
| Month [-] | Tmin °C | Tmax °C | Mean °C | σ | n |
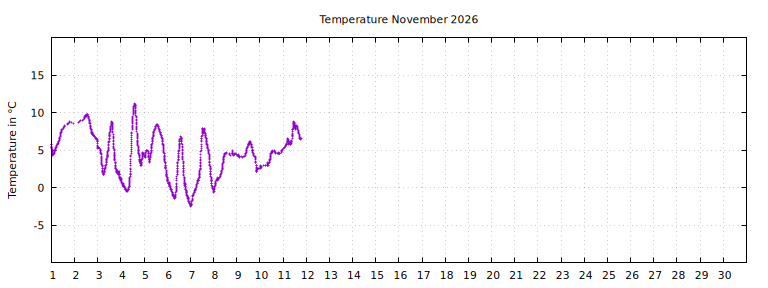
| November 2026 | -2.5 | 11.2 | 4.3 | 291% | 1260 |
| October 2026 | -0.8 | 20.8 | 9.9 | 390% | 3425 |
| September 2026 | 3.7 | 23.9 | 14.5 | 376% | 4639 |
| August 2026 | 6.2 | 31.2 | 18.5 | 531% | 5639 |
| July 2026 | 8.1 | 38.7 | 21.4 | 639% | 6196 |
| June 2026 | 5.0 | 38.9 | 19.4 | 637% | 6235 |
| May 2026 | 1.8 | 31.7 | 15.5 | 640% | 3600 |
 |
| Yearly Statistics | |||||
| Year [+] | Tmin °C | Tmax °C | Mean °C | σ | n |
| 2026 | -2.5 | 38.9 | 16.8 | 700% | 30994 |
Currently 30995 temperuture meausurements in the database.
|
| (c) Daniel Vindevåg 2004-2021 |
))
))
))
))
))
))
))
))