))
))
))
))
))
))
))
))
))
))
))
))
))
))
))
))
))
))
))
))
))
))
))
))
))
))
))
))
))
))
| Daily Statistics | |||||
| Day [+] | Pmin W | Pmax W | PMean W | Energy KWh | n |
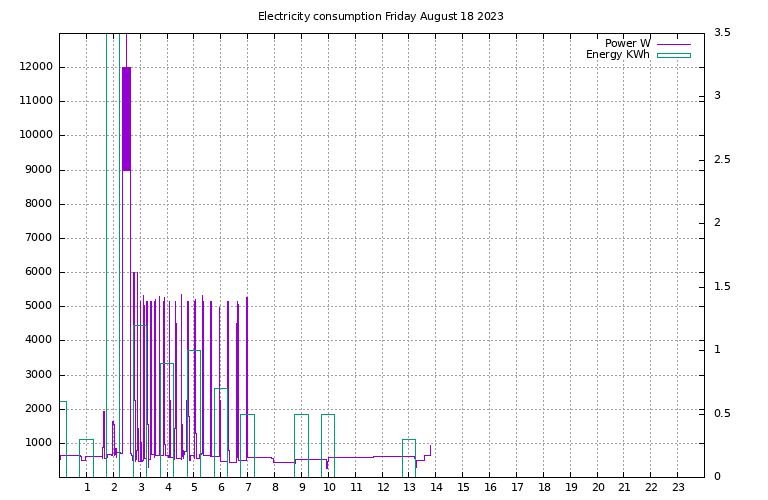
| Friday August 18th | 270 | 18000 | 924 | 12.7 | 433 |
| Thursday August 17th | 276 | 12000 | 870 | 20.6 | 640 |
| Wednesday August 16th | 243 | 2250 | 534 | 12.5 | 95 |
| Tuesday August 15th | 191 | 734 | 516 | 12.3 | 97 |
| Monday August 14th | 264 | 2117 | 511 | 11.5 | 91 |
| Weekly Statistics | |||||
| Week [-] | Pmin W | Pmax W | PMean W | Energy KWh | n |
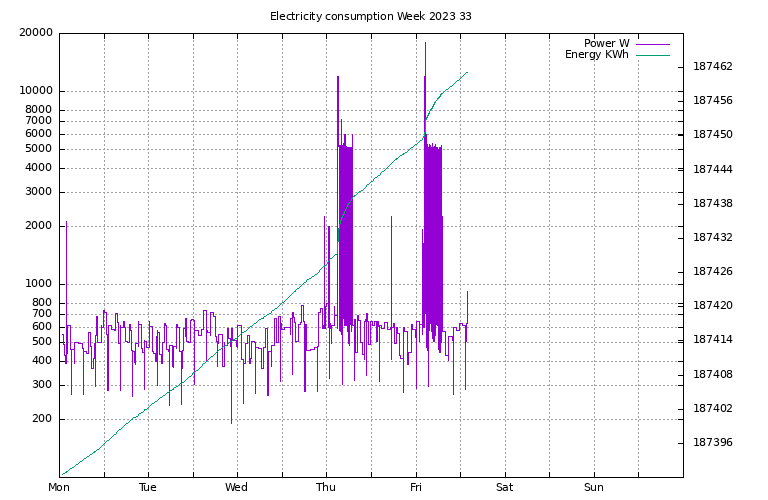
| Week 33 (August 14th) | 191 | 18000 | 649 | 70.7 | 1356 |
| Week 32 (August 7th) | 188 | 12000 | 993 | 166.7 | 2299 |
| Week 31 (July 31st) | 230 | 18000 | 1680 | 282.2 | 6829 |
| Week 30 (July 24th) | 225 | 18000 | 821 | 137.5 | 2508 |
| Week 29 (July 17th) | 238 | 12000 | 603 | 100.7 | 1215 |
| Updated every hour. |
|
|
| Monthly Statistics | ||||||
| Month [+] | Pmin W | Pmax W | PMean W | Energy KWh | Meter KWh | n |
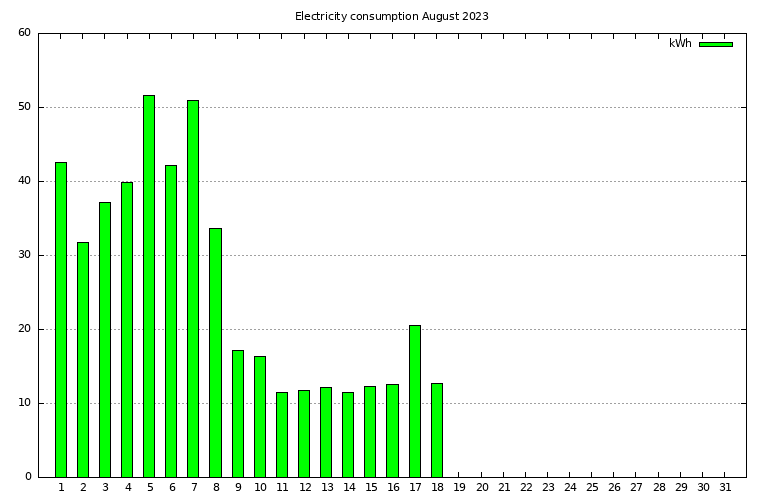
| August 2023 | 188 | 18000 | 1147 | 483.7 | 187461.2 | 9661 |
| July 2023 | 203 | 18000 | 780 | 580.4 | 186977.4 | 9556 |
| June 2023 | 192 | 12000 | 612 | 440.1 | 186396.5 | 4023 |
 |
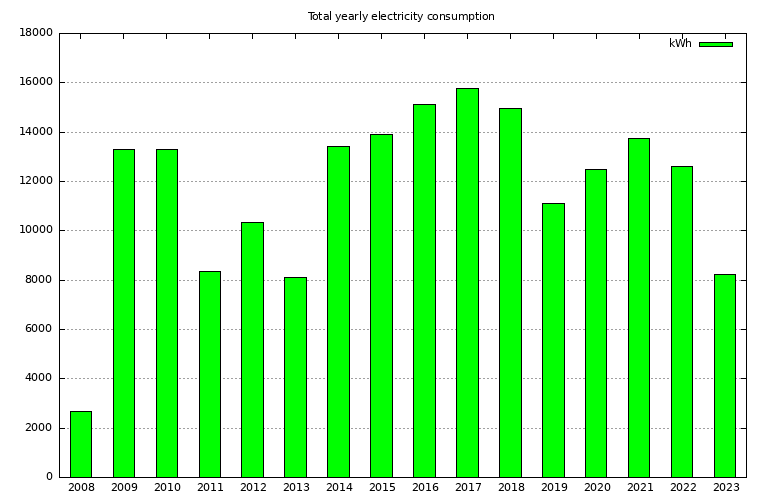
| Yearly Statistics | |||||
| Year [+] | Pmin W | Pmax W | PMean W | Energy KWh | n |
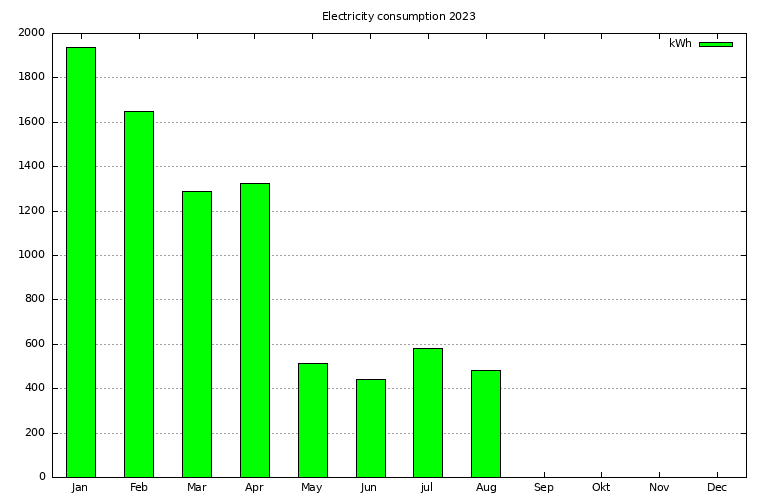
| 2023 | 188 | 18000 | 1492 | 8220 | 280325 |
| 2022 | 2 | 24000 | 1439 | 12608 | 335324 |
| 2021 | 4 | 23076 | 1571 | 13763 | 324160 |
 | |
 |
Currently 2830413 meausurements in the database.
|
| (c) Daniel Vindevåg 2014 |
))
))
))
))
))
))
))
))
))
))
))
))