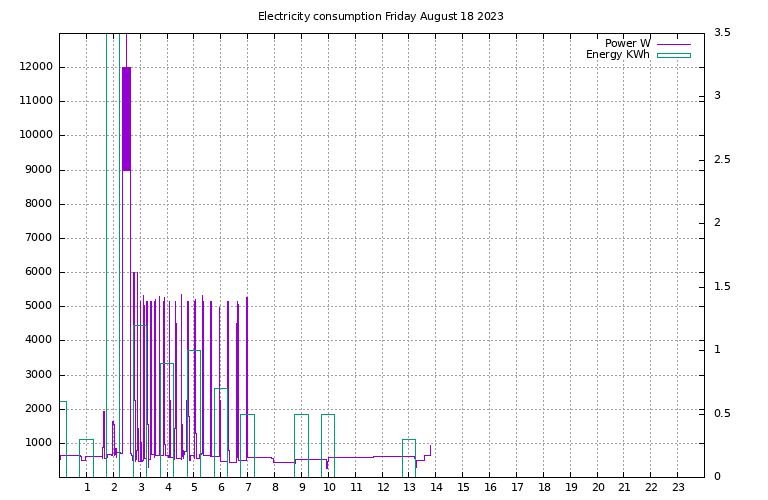
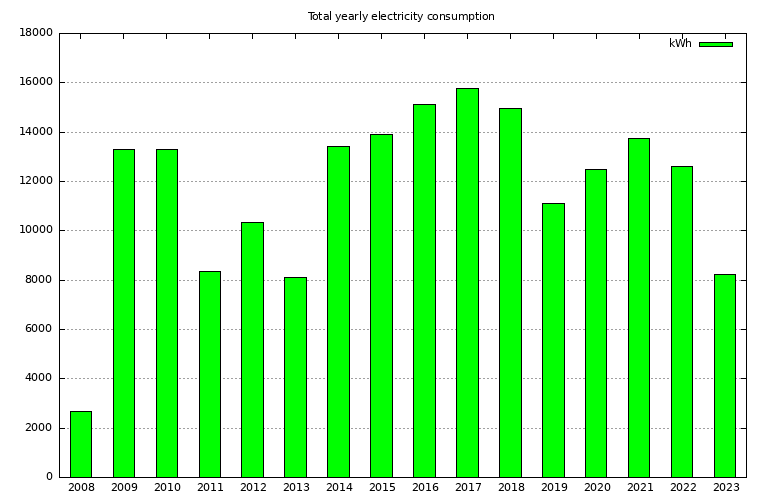
Electricity consumption, Nattsjo 1:15
Electricity meter August 18th, 13:47
187461 kWh
923 W
, WARNING - Not updating!
| Updated every hour. |
 |
| |
 |
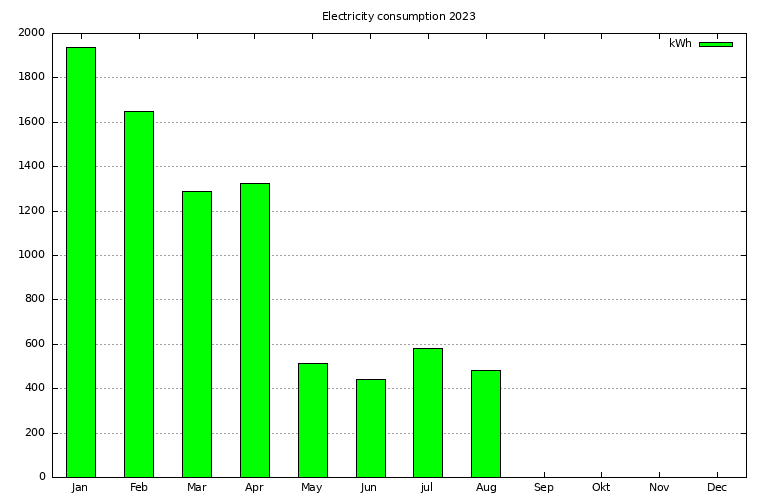
| Yearly Statistics |
| Year
[-] |
Pmin W |
Pmax W |
PMean W |
Energy KWh |
n |
| 2023 | 188 | 18000 | 1492 | 8220 | 280325 |
| 2022 | 2 | 24000 | 1439 | 12608 | 335324 |
| 2021 | 4 | 23076 | 1571 | 13763 | 324160 |
| 2020 | 34 | 18000 | 1420 | 12471 | 222608 |
| 2019 | 144 | 24000 | 1266 | 11090 | 177593 |
| 2018 | 48 | 26476 | 1709 | 14972 | 136439 |
| 2017 | 51 | 30000 | 1801 | 15776 | 212266 |
| 2016 | 38 | 19800 | 1723 | 15137 | 205117 |
| 2015 | 7 | 18000 | 1589 | 13919 | 359703 |
| 2014 | 2 | 18339 | 1533 | 13430 | 190345 |
Currently 2830413 meausurements in the database.

| (c) Daniel Vindevåg 2014 |
))
))
))
))
))
))
))
))
))
))
))
))
))
))
))
))
))
))
))
))
))
))
))
))
))
))
))
))
))
))
))
))
))
))
))
))
))
))
))
))
))
))
))