))
))
))
))
))
))
))
))
))
))
| Daily Statistics | |||||
| Day [+] | Tmin °F | Tmax °F | Mean °F | σ | n |
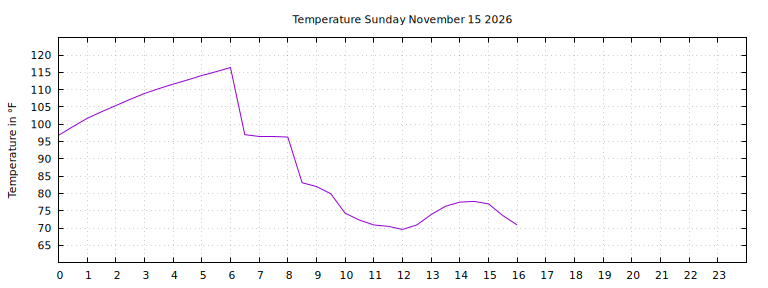
| Sunday November 15th | 69.6 | 116.4 | 90.6 | 1621% | 33 |
| Saturday November 14th | 56.8 | 101.1 | 67.1 | 1162% | 48 |
| Friday November 13th | 59.5 | 154.8 | 95.2 | 3507% | 48 |
| Thursday November 12th | 67.6 | 156.6 | 108.3 | 2808% | 48 |
| Wednesday November 11th | 63.5 | 138.9 | 90.2 | 2411% | 48 |
| Weekly Statistics | |||||
| Week [-] | Tmin °F | Tmax °F | Mean °F | σ | n |
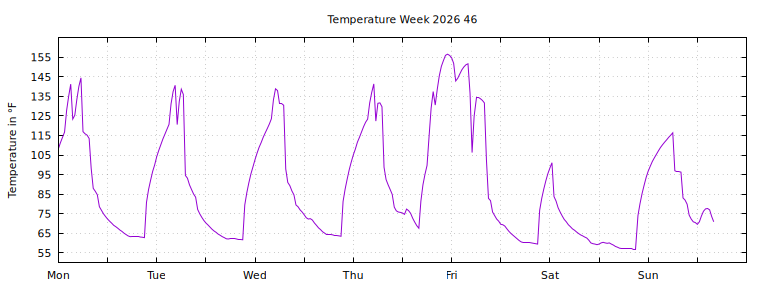
| Week 46 (November 9th) | 56.8 | 156.6 | 90.0 | 2775% | 321 |
| Week 45 (November 2nd) | 54.9 | 162.1 | 80.3 | 2919% | 336 |
| Week 44 (October 27th) | 55.9 | 119.8 | 68.0 | 1105% | 283 |
| Week 43 (October 19th) | 63.7 | 153.9 | 94.6 | 2516% | 143 |
| Week 42 (October 12th) | 65.5 | 162.0 | 113.1 | 3043% | 336 |
| Updated every 30:th minute. |
|
|
| Monthly Statistics | |||||
| Month [+] | Tmin °F | Tmax °F | Mean °F | σ | n |
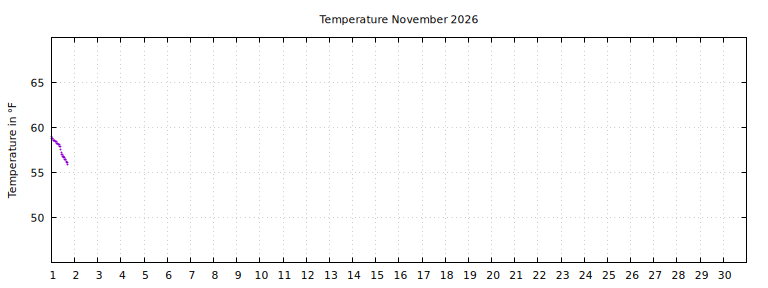
| November 2026 | 54.9 | 162.1 | 83.1 | 2877% | 705 |
| October 2026 | 59.0 | 164.5 | 110.1 | 3152% | 1242 |
| September 2026 | 82.2 | 160.9 | 121.3 | 1893% | 1417 |
 |
| Yearly Statistics | |||||
| Year [+] | Tmin °F | Tmax °F | Mean °F | σ | n |
| 2026 | 50.2 | 179.2 | 109.0 | 3202% | 14186 |
| 2025 | 49.3 | 178.5 | 101.7 | 3486% | 17141 |
| 2024 | 48.7 | 177.4 | 104.5 | 3806% | 16197 |
Currently 334572 temperuture meausurements in the database.
|
| (c) Daniel Vindevåg 2004-2021 |
))
))
))
))
))
))